
The University of Applied Sciences Utrecht has undertaken a comprehensive inventory of shared mobility vehicles and hubs in the Province of Utrecht as part of the efforts to improve their shared and digital mobility hubs.
Their goal? To create a plan for rolling out shared mobility services that will operate across municipal borders. But to increase mobility hubs, it is necessary to assess the current state of the ones existing. This deliverable highlights key findings, challenges, and strategic insights for creating a seamless multimodal transport network. Here’s a concise overview tailored to inform city officers about the deliverable’s relevance and application.
What the deliverable covers
This report provides a detailed inventory of shared mobility services across the Province of Utrecht, assessing vehicles, providers, and mobility hubs. It identifies 100 mobility hubs, of which 80 include at least one shared mobility option, and highlights the dominance of cars, bicycles, and public transport modes. The document also explores methodologies for hub identification and spatial analysis, which can serve as a blueprint for similar studies. Finally, this research is followed up with research on the identification of potential new hub places, and the development of a data dashboard, that can provide information to municipalities and other stakeholders regarding the effects of shared mobility.
Key insights from the deliverable
1. Defining shared mobility Hubs
Hubs are locations where two or more transport modes are available within close proximity (150 metres). These hubs are critical for enabling seamless transfers between modes and supporting Mobility as a Service (MaaS) frameworks.
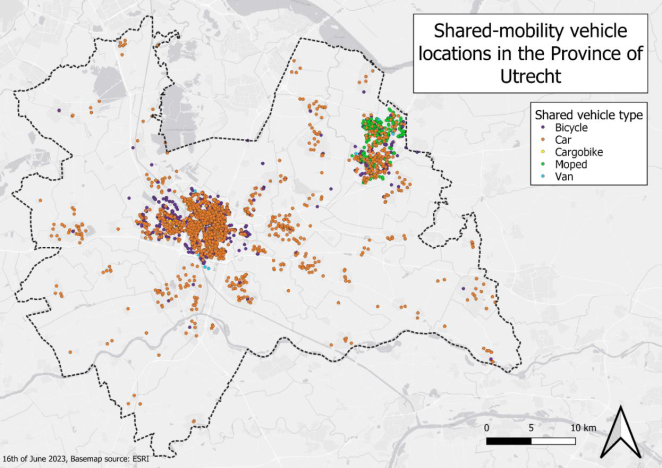
2. Inventory results
- Shared mobility distribution: Cars are the most prevalent shared modality, followed by bicycles and mopeds. Urban areas like Utrecht and Amersfoort have a higher density and variety of shared mobility options than rural areas.
- Hub composition: The most common hubs are those connecting buses and cars. Hubs with at least three modalities (e.g., bike, car, and public transport) are less frequent but play a vital role in mobility integration.
3. Challenges in data collection and analysis
- Data Fragmentation: Shared mobility data is managed by multiple providers, leading to inconsistencies and gaps.
- Free-Floating Vehicles: These are excluded from hub analysis due to their lack of fixed locations, which limits the scope of the findings.
4. Methodology
Using GIS tools, the deliverable employs a buffer-based clustering approach to identify hubs and assess their composition. Alternate scenarios with varying proximity thresholds (100m, 200m) reveal the sensitivity of hub identification to distance parameters
Recommendations for public authorities
- Standardise data collection: Municipalities should adopt uniform data-sharing protocols with mobility providers to ensure comprehensive and consistent datasets.
- Expand and optimise hubs: Focus on areas with existing hubs to improve multimodal connections and identify underserved regions for new hub development.
- Apply the digital framework: The GIS-based process offers a replicable approach for cities to analyse their own shared mobility ecosystems, enabling efficient data-driven decision-making.
- Collaborate with providers: Shared mobility providers are integral to hub success. Establish partnerships to ensure consistent data sharing and support seamless integration into multimodal networks.
- Enhance visibility and accessibility: Officially label identified hubs with uniform signage and improve user awareness through public-private partnerships.
- Incorporate free-floating options: Develop methods to include free-floating vehicles in future analyses, providing a more accurate picture of mobility offerings.
Tools for policy
This deliverable is a critical tool for understanding and enhancing shared mobility in the Province of Utrecht. It provides actionable insights into hub distribution, composition, and data management, offering a blueprint for municipalities aiming to create a cohesive multimodal transport network. By leveraging the findings and digital framework outlined in the report, cities can take concrete steps toward more sustainable and efficient mobility systems.