
The renaturation of the peatland is one of the biggest tasks, especially in the federal state of Lower Saxony (Germany), to achieve national climate targets.
Another problem is the increasing groundwater salinization in coastal environments and further inland, which means that the groundwater can no longer be used for drinking water supply. Managed aquifer recharge could be an option to push the fresh-saline groundwater interface downwards and to preserve the freshwater resource.
In the GE 2 pilot, we want to simulate the combination of different adaptation strategies to learn about the effects on the groundwater system in geest and in peatland areas. In order to plan such measures, the hydrogeological characteristics of the pilot area must be well known. Therefore, several geophysical surveys were carried out throughout the year.
1. GPR
The Leibniz Institute for Applied Geophysics (LIAG) acquired information about the peatland extension, its thickness, possible sub-division and alteration using ground penetrating radar (GPR). The collected GPR data provides shallow information of a depth of about 5 m below the surface.
A strong reflector was obtained within the Gnarrenburg peatland, whose thickness increases from 0 m to 4 m from South to North (Figure 1). In addition, the transition from the peat base to the lowerlying sandy sediments is characterized by a strong increase in the GPR wave velocity.
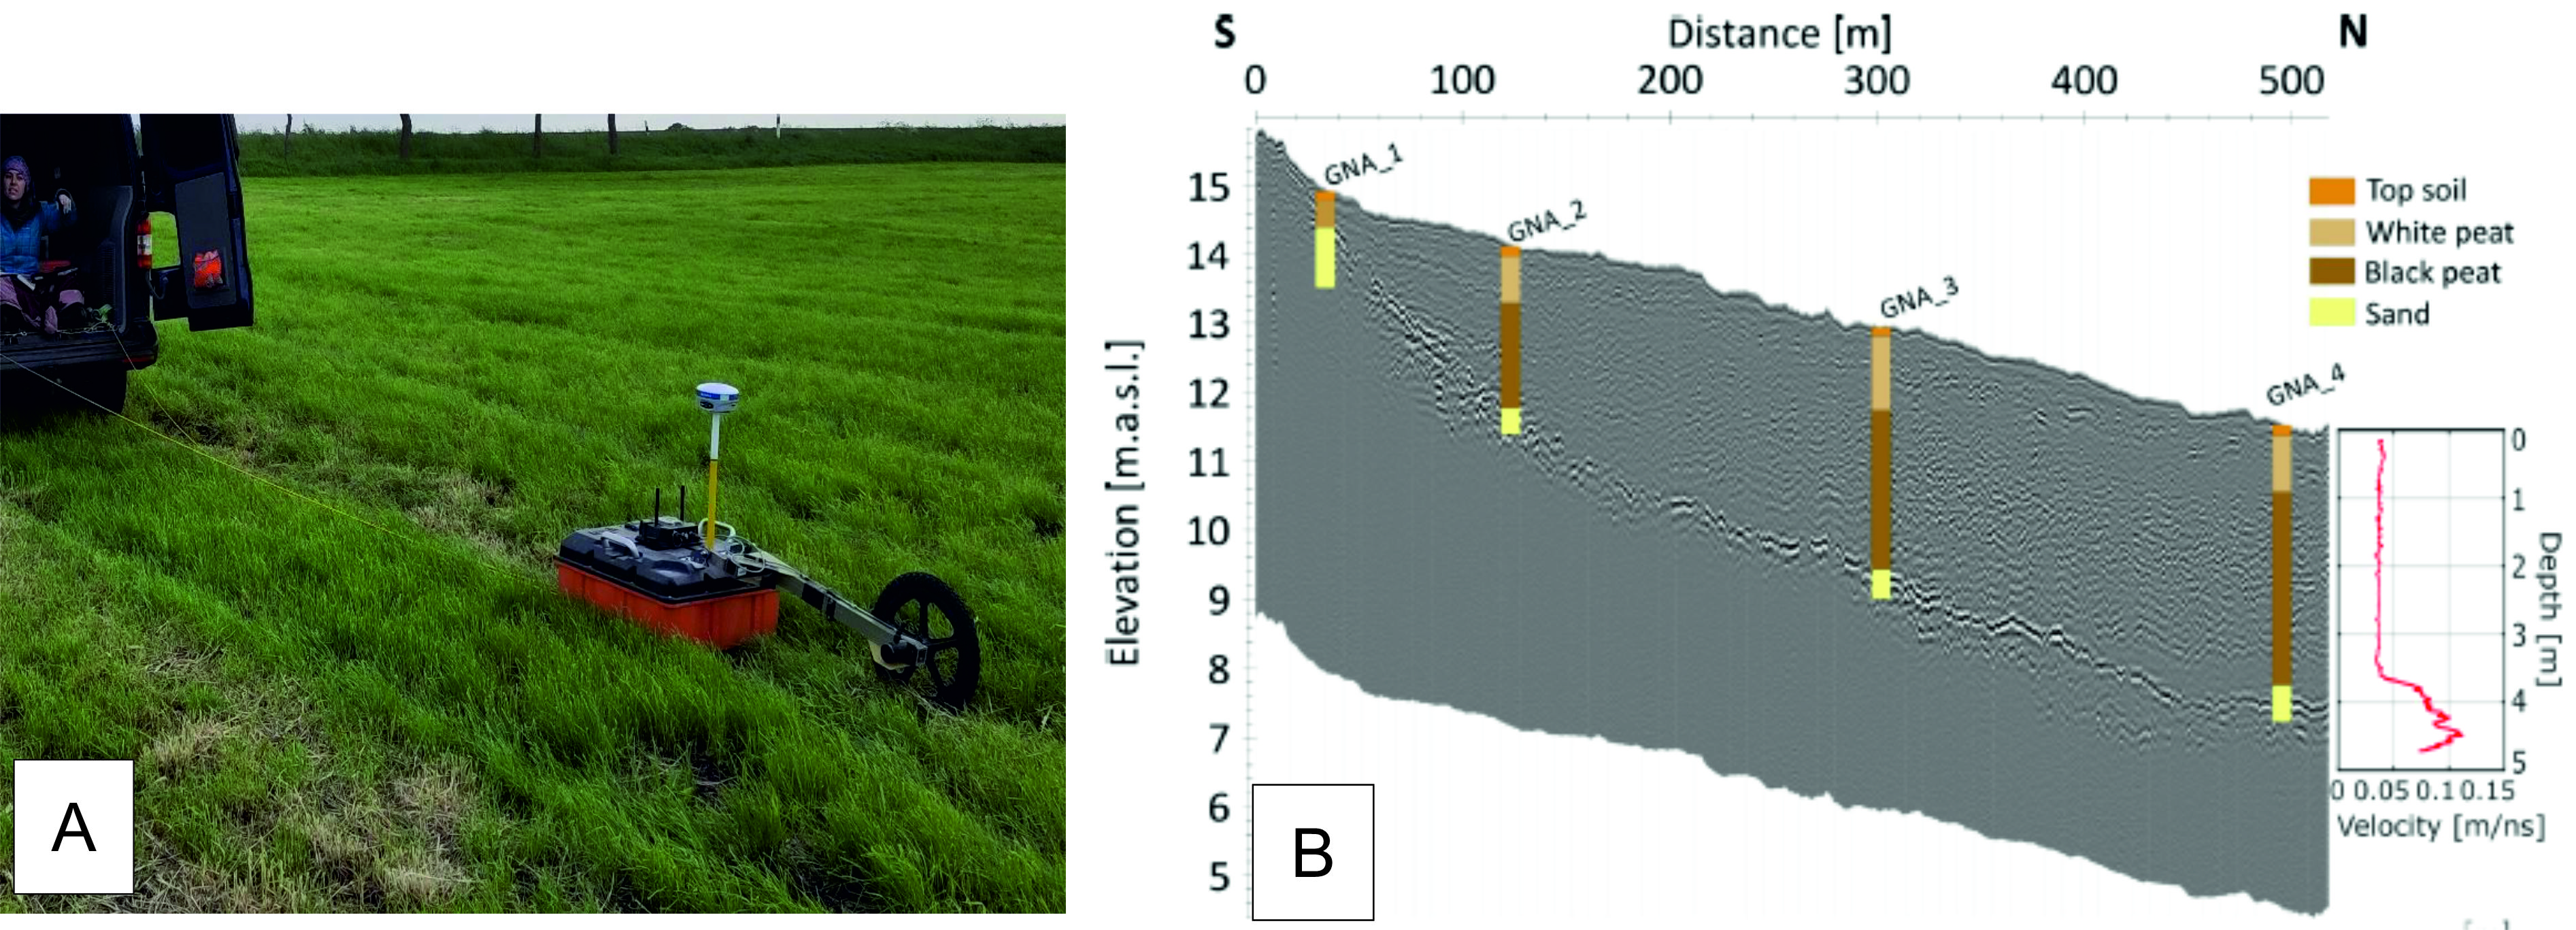
Figure 1. (A) GPR device. Is a non-destructive and fast tool for mapping and monitoring peat thickness. (B) GPR profile in south-north direction with the borehole information. Velocity at GNA_4 site based on the guided wave technique.
2. Drone EM
On a deeper scale (100 m – 5 km below the surface), LIAG used the semi-airborne electromagnetic (SAEM) method to provide a 3D conductivity distribution model that explores the occurrence and extent of groundwater protecting clay/silt layers in the sandy sediments and possible deep salinization. The survey covers an area of 1.5 x 1.5 km2 , and the data collection was carried out at the end of October.
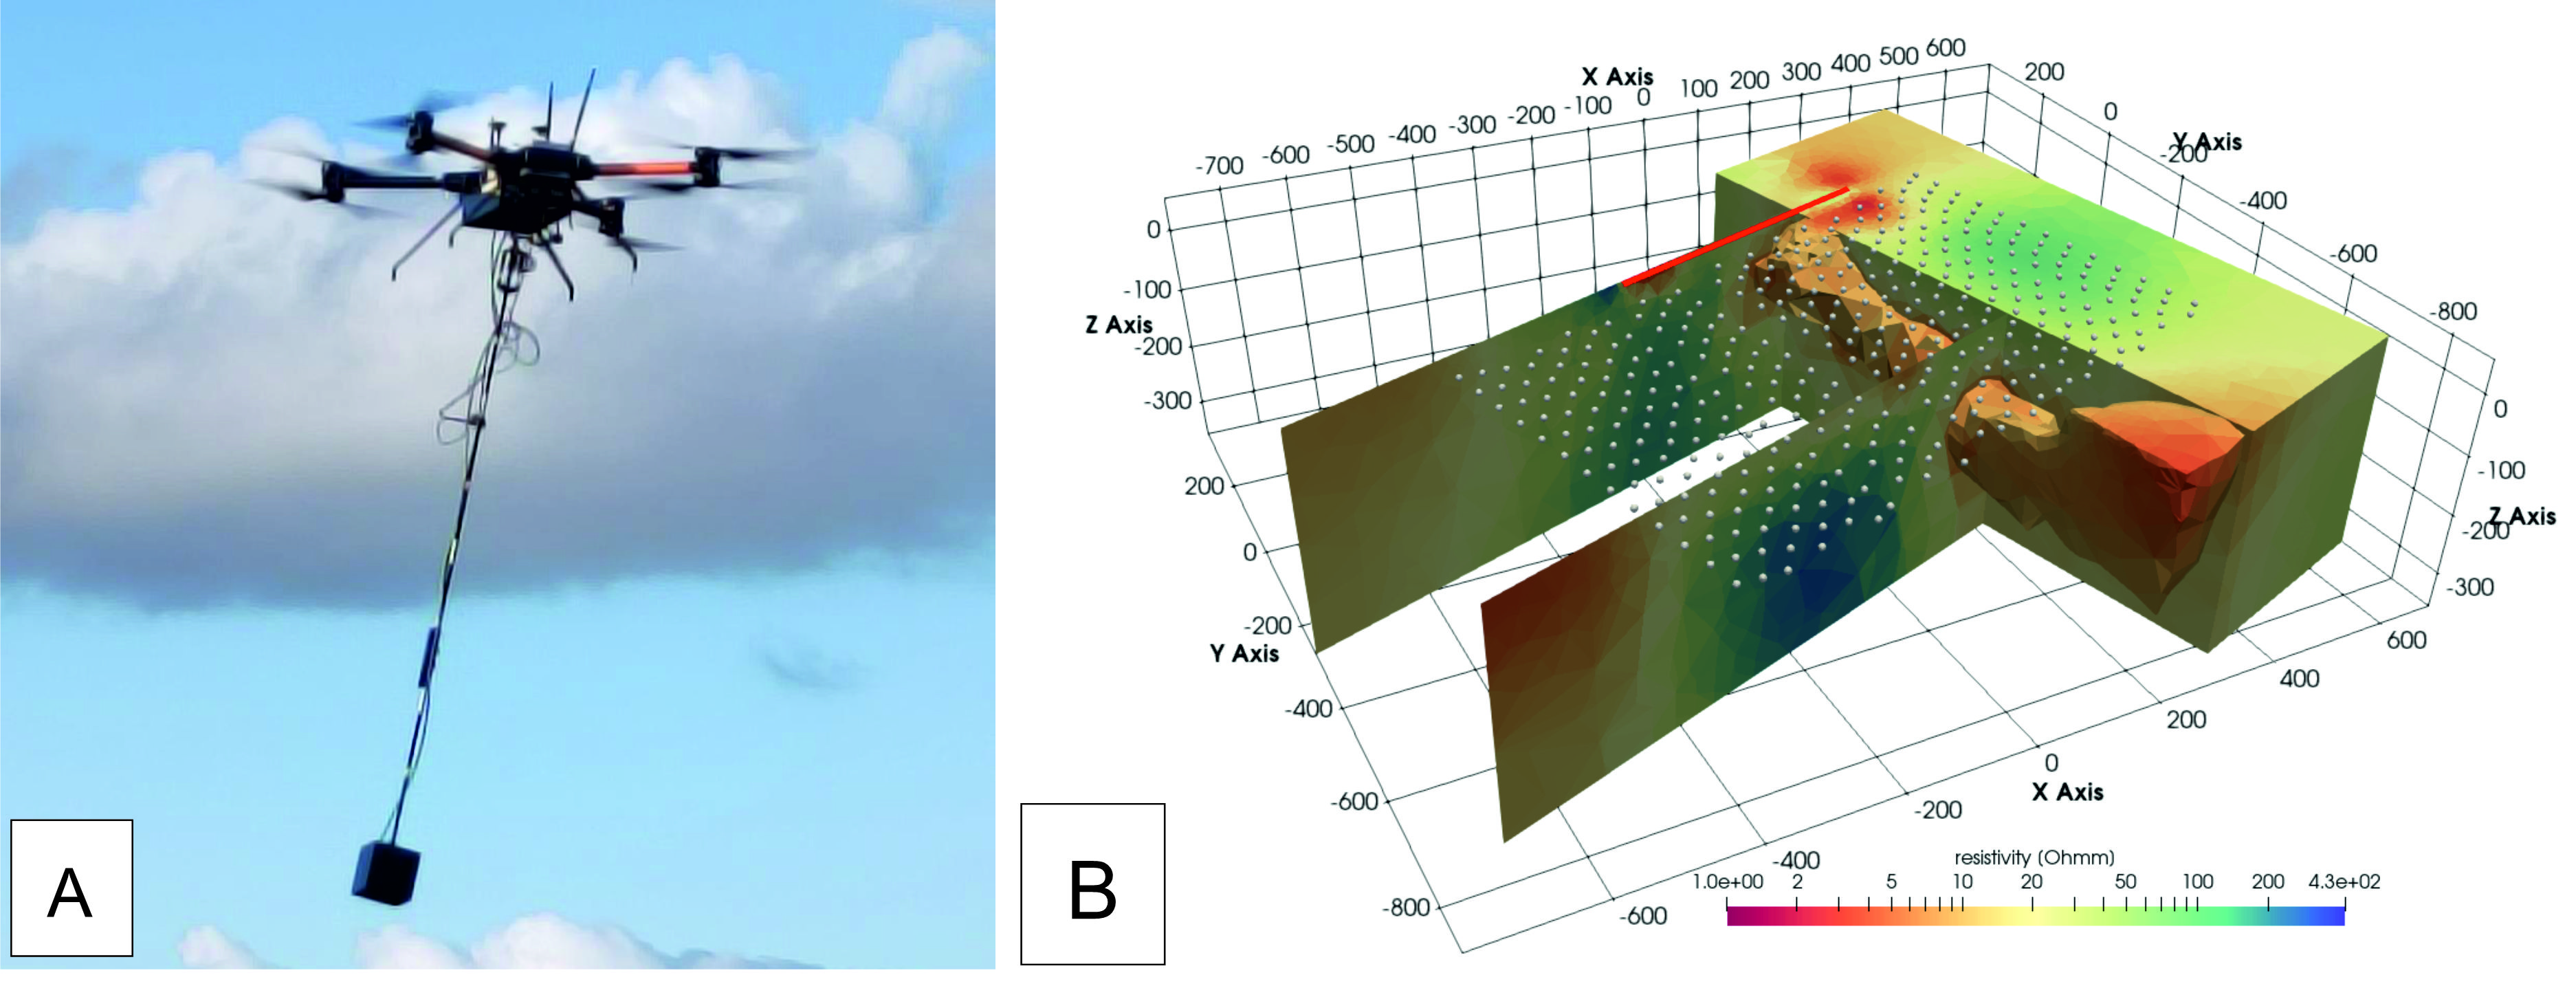
Figure 2. Drone and the instruments in the air (A) and an example of a 3D inversion of the SAEM data (B).
3. Sky-TEM
SkyTEM Surveys Aps acquired electromagnetic data during a survey from October 25th to November 04th. They covered in total 2011 flight km on 241 lines with 300 m distance in between. The data processing (by Aarhus Geophysics) results in a quasi-3D model showing the variation of the specific electrical resistivity in the subsurface up to 300 m below surface. From the spatial distribution of the electric resistivity, conclusions can be drawn about the composition of the sediment and salinized groundwater (similar to the data acquired by Drone EM).
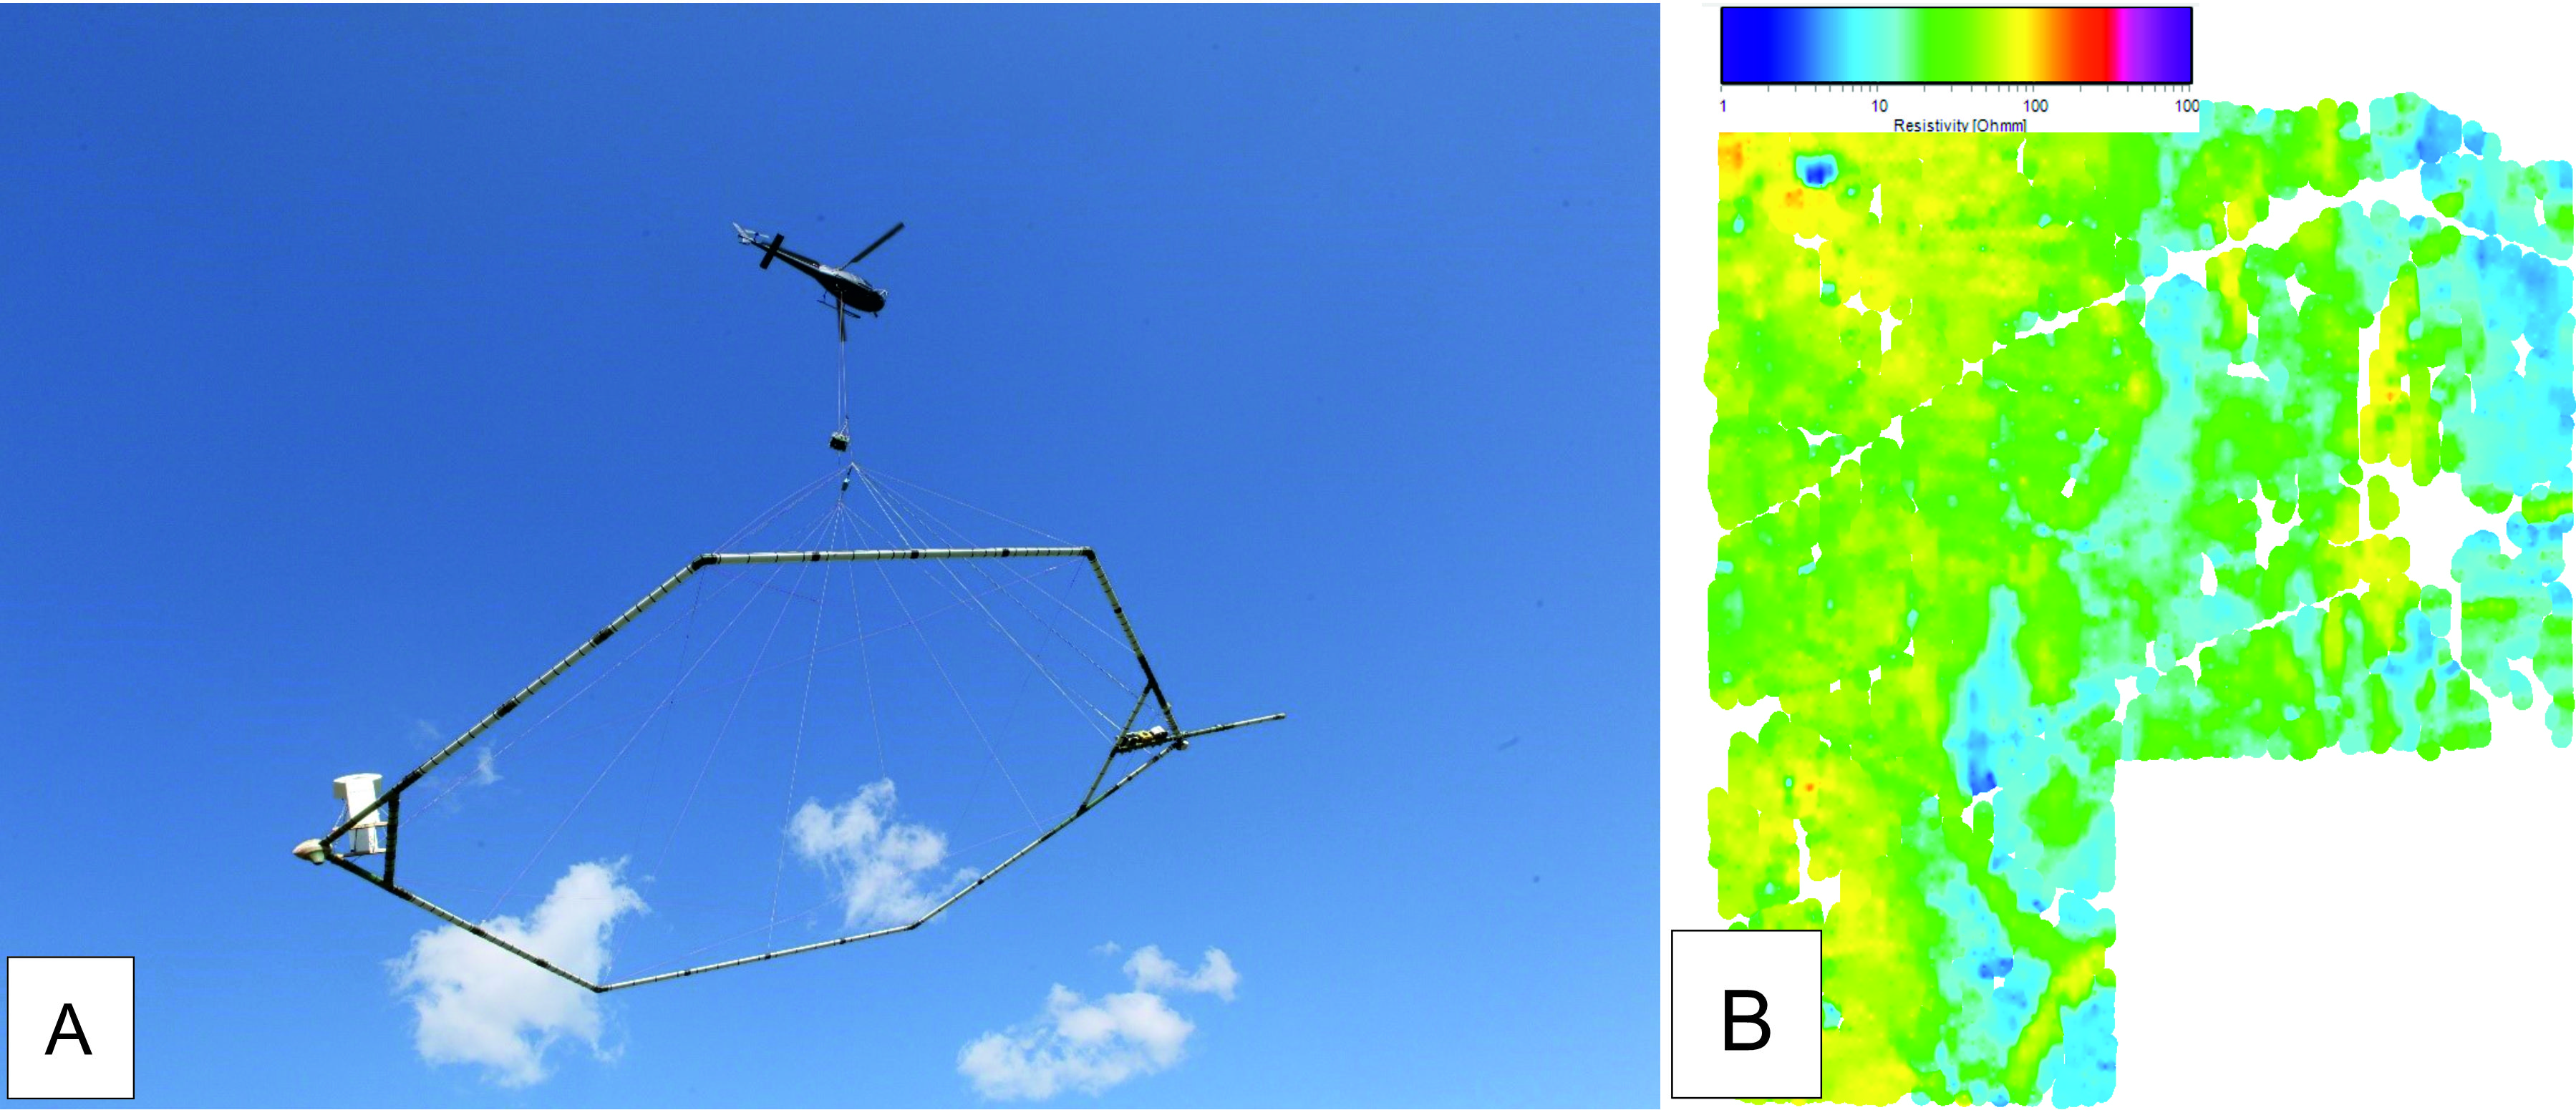
Figure 3. All SkyTEM instruments are in the frame, approximately 40 m below the helicopter and 30
m above the surface (A) and an example of the variation of the specific electrical resistivity in the
subsurface (B).